

Report a Problem
Something doesn’t work as expected? A good report contains a clear description, your configuration and a log that shows the problem. This page shows where to report and how to collect that information.
Why a Good Report Matters
Section titled “Why a Good Report Matters”Every installation is different. Devices, firmware versions, settings and the network vary from home to home. We’re a community of users and developers who help each other. We’d like to help you too, but we can’t look at your system. Your report is our only view into it.
With a description, the configuration and a log that shows the problem, we can often find the cause in the first reply. A precise report also lets us reproduce a bug, and that’s what we need to fix it. Others with the same problem benefit too, because they find your post and its solution.
Before You Report
Section titled “Before You Report”- Update: Use the latest version. For bugs, verify with the latest nightly build, the problem may already be fixed there.
- Search: Check discussions, issues and the FAQ, including closed posts. If your problem is already there, add your details to that post.
- Reproduce: Trigger the problem again and note the time. You need it to find the matching log entries.
- Isolate: Pause external automations (e.g. Home Assistant, Node-RED, ioBroker). Two systems controlling the same device often cause the problem.
- Focus: Report one problem per post.
Where Does the Problem Belong?
Section titled “Where Does the Problem Belong?”- evcc-io/evcc: Core repository for charging, devices, tariffs and the web interface
- evcc-io/app: iOS & Android app, if it works fine in the web browser
- evcc-io/docs: Documentation on docs.evcc.io. Device pages are generated from the core repository. The Edit page link at the bottom of every page leads to the right source.
- evcc-io/evcc.io: Landing page evcc.io, e.g. typos
- evcc-io/optimizer: Optimizer, if the calculated results are implausible or unexpected
Problems with the Linux image belong to evcc-io/images, problems with the Home Assistant app to evcc-io/hassio-addon.
Discussion or Bug?
Section titled “Discussion or Bug?”- Discussion: Questions and help with your setup. Most unexpected behaviour turns out to be a matter of configuration or settings.
- Bug: Something worked before and stopped working after an update, or the behaviour clearly contradicts the documentation. Bugs are reported as an issue.
If you can’t rule out a settings problem, start with a discussion.
Report from the Web Interface
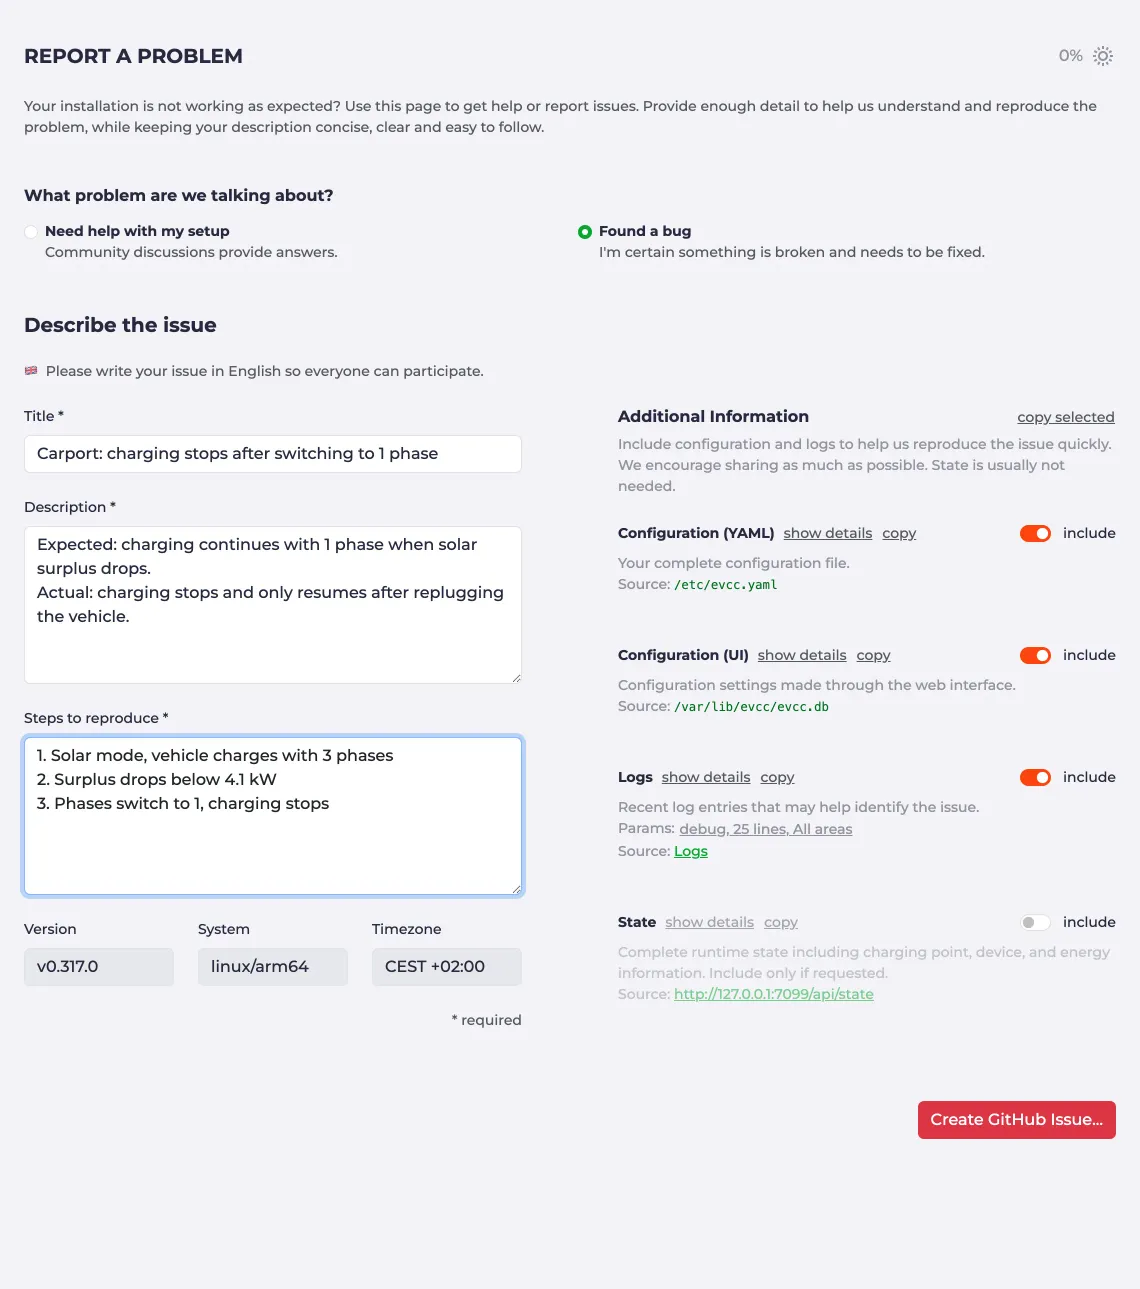
Section titled “Report from the Web Interface”The Report a problem page collects version, system, configuration and logs for you. It creates a prepared discussion or issue on GitHub. You need a GitHub account for this.
-
Open More → Report a problem.
-
Select Need help with my setup or Found a bug.
-
Fill in Title, Description and Steps to reproduce. Describe what you expected and what happened instead.
-
Check the Additional Information. For Logs, click the parameters and choose level, number of lines and areas. For longer periods, capture a log and attach it as a file. Only include State if someone asks for it.
Report a problem page with description and additional information -
Click Create GitHub Issue… or Start GitHub Discussion….
-
If the additional information is too long for a link, the dialog shows two steps. Create the post on GitHub first. Then return to your instance, click Copy additional information and paste it into the post at the marked position. Without this second step your post contains neither configuration nor logs.

If you write the post on GitHub by hand, you can copy each section on this page individually with copy.
Capture a Log
Section titled “Capture a Log”The Logs page always records all levels including trace.
You don’t need to change the configuration or restart.
-
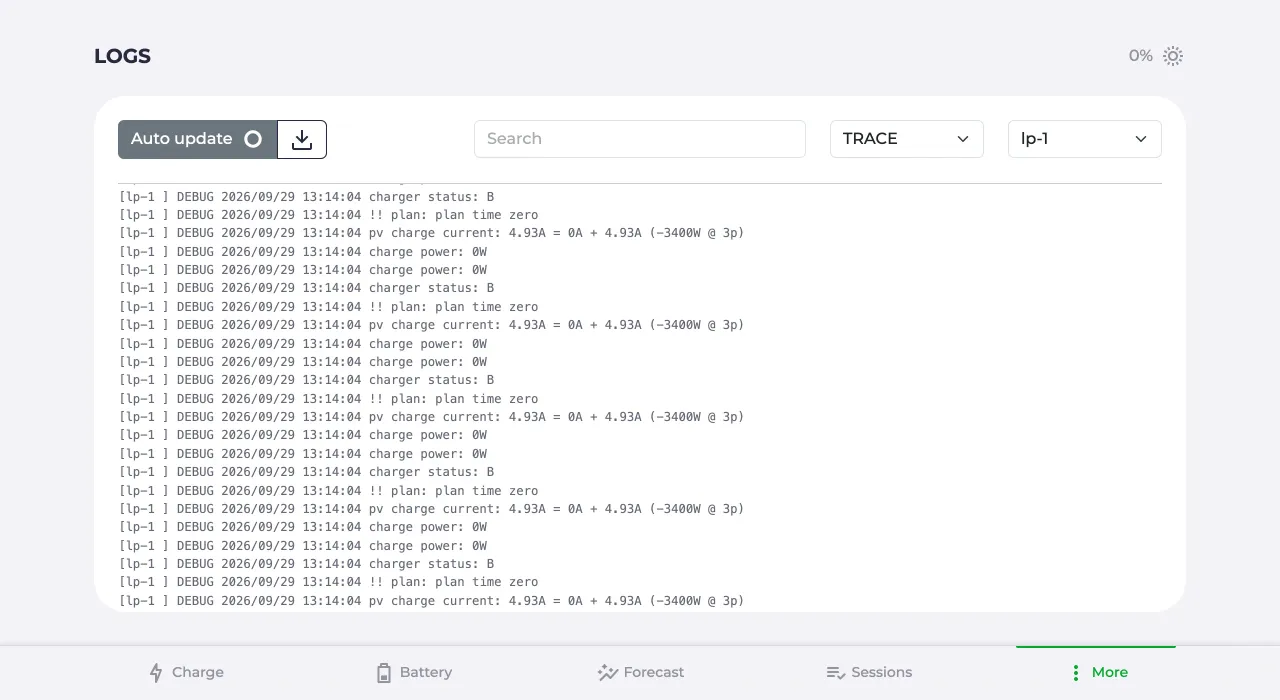
Open More → Logs.
-
Select the level TRACE and the areas of the affected charging point and devices.
Logs page filtered by level TRACE and area lp-1 -
Reproduce the problem. For connection problems (e.g. OCPP, EEBUS, Modbus), restart your instance first so the log covers everything from the start.
-
Click the download button right after the problem occurred. The file contains the entries of the selected level and areas.
-
Attach the file to your post on GitHub via drag and drop.

The log starts before the problem arises and runs until it’s visible. That way it shows how the problem came about.
The Logs page keeps the last 10,000 entries, roughly 30 to 90 minutes depending on your setup. A restart clears them. For longer periods use the long-term logs.
The Logs page shows the level debug by default, which covers the decisions of the control loop.
trace adds the raw communication with devices and services.
Long-Term Logs
Section titled “Long-Term Logs”The Logs page covers a limited window. When you need more data, a longer period or entries from before a restart, use the logs of your system. They’re also the way to go when the web interface isn’t reachable.
These logs only contain entries of the configured level, which is info by default.
Raise the level before you reproduce the problem.
Raise the Log Level
Section titled “Raise the Log Level”The level is set in the configuration file evcc.yaml, in general and per area.
The example sets debug in general and trace for the first charging point.
You find the names of your areas in the area filter of the Logs page.
log: debuglevels: lp-1: traceIf the file doesn’t exist yet, create it with only these lines.
Your configuration from the web interface stays untouched.
Set the level back once you have the log, because trace creates a lot of data.
Logs by Installation
Section titled “Logs by Installation”Where the logs are and which file you adjust depends on how you installed evcc. Open the panel that matches your installation.
Raspberry Pi & Co. (evcc Linux Image)
Open Cockpit at https://evcc.local:9090.
Edit files with Navigator and run commands in Terminal.
To raise the log level, edit /etc/evcc.yaml and restart:
sudo systemctl restart evccShow the entries of the last hour:
sudo journalctl -u evcc --since "1 hour ago" --no-pagerFollow the log live:
sudo journalctl -fau evccShow a time range:
sudo journalctl -u evcc -S "2026-03-21 07:00" -U "2026-03-21 08:00" --no-pagerCopy the output from the terminal into your post.
Docker
To raise the log level, add it to your compose.yml if you use Docker Compose, or to the evcc.yaml that you mounted into the container.
services: evcc: environment: - EVCC_LOG=debug,lp-1:traceRecreate the container:
docker compose up -dlog: debuglevels: lp-1: traceRestart the container:
docker restart evccShow all entries of the container named evcc:
docker logs evccFollow the log live:
docker logs -f --since 10m evccShow the entries of the last hour:
docker logs --since 1h evccCopy the output from the terminal into your post.
With Docker Compose use docker compose logs evcc in the folder of your compose.yml.
Docker UIs (e.g. Synology, QNAP, Portainer, Unraid) show the log in the details of the container.
Recreating the container deletes its log.
For how to keep logs permanently, see the documentation of your Docker UI.
Home Assistant
To raise the log level, edit /addon_configs/49686a9f_evcc/evcc.yaml.
In the Configuration tab of the app, config_file must be set to /config/evcc.yaml.
Restart the app afterwards.
See Configuration File for how to edit the file.
To get the logs, open Settings → Apps → evcc in Home Assistant and select the Log tab.
Proxmox
Open the console of the container in Proxmox.
To raise the log level, edit /etc/evcc.yaml and restart:
sudo systemctl restart evccShow the entries of the last hour:
sudo journalctl -u evcc --since "1 hour ago" --no-pagerFollow the log live:
sudo journalctl -fau evccShow a time range:
sudo journalctl -u evcc -S "2026-03-21 07:00" -U "2026-03-21 08:00" --no-pagerCopy the output from the terminal into your post.
Linux
To raise the log level, edit /etc/evcc.yaml and restart:
sudo systemctl restart evccShow the entries of the last hour:
sudo journalctl -u evcc --since "1 hour ago" --no-pagerFollow the log live:
sudo journalctl -fau evccShow a time range:
sudo journalctl -u evcc -S "2026-03-21 07:00" -U "2026-03-21 08:00" --no-pagerCopy the output from the terminal into your post.
macOS
If you’ve installed with Homebrew and set up the launchd agent as described under macOS, the log is written to a file.
To raise the log level, edit /etc/evcc.yaml and restart:
launchctl kickstart -k gui/$(id -u)/io.evccShow the logs:
tail -f "$(brew --prefix)/var/log/evcc.log"FreeBSD
To raise the log level, edit /usr/local/etc/evcc.yaml and restart:
service evcc restartFollow the log file:
tail -f /var/log/evcc.logWindows
To raise the log level, edit the evcc.yaml in the folder of evcc.exe and restart the service.
The service must be started with the argument -c evcc.yaml.
Log files only exist if you set up the output redirection in the I/O tab of the background service. Without a service, start the program in a terminal window to see the output.
Feature Requests
Section titled “Feature Requests”A device or a function is missing? The community is large, so chances are good that someone has had a similar idea before. Take a little time for research before you submit your request as an issue.
- Research: Check the discussions and the closed issues to see if the topic has come up before.
- Reviving is fine: Circumstances may have changed since a topic was last discussed.
- What and why: Describe what you’d like to achieve, not only the solution you have in mind.
- New devices: Name the concrete device and attach the API documentation or data sheet provided by the vendor. Be prepared to test and verify with your own device.